EEOB/BCB 5460: Programming with Python
Indexing, Slicing, Subsetting, and Iterating DataFrames in Python
Overview
Questions
How do you extract data from columns and rows?
How do you select subsets of the DataFrame?
How do you reassign values within the DataFrame?
Objectives
Extract data using column headings and index locations.
Use slicing to select sets of data from a DataFrame.
Use label and integer-based indexing to select ranges of data in a DataFrame.
Create a copy of a DataFrame.
Locate subsets of data using masks.
Loop over rows and update values.
More on Pandas DataFrames
In the last lesson, we read a CSV file into a DataFrame and saved it to a named object. With the data in memory, we performed basic math on the data, calculated summary statistics, and created plots of the data. In this lesson, we will explore ways to access different parts of the data using indexing, slicing and subsetting.
Create a New Jupyter Notebook
Open a new notebook for this episode.
You can call it 04-More-Dataframes.
Remember to start this new notebook with a
description of what it is for. You can do this
using a Markdown cell at the very beginning.
Also make sure that you save this notebook to the
same place you have saved the data file (surveys.csv).
Import Pandas and Load the Data
We will continue to use the surveys dataset that we worked with in the last exercise. Import the DataFrame and load the CSV file:
import pandas as pd
surveys_df = pd.read_csv("surveys.csv")
Indexing & Slicing in Python
We often want to work with subsets of a DataFrame object. There are different ways to accomplish this including: using labels (column headings), numeric ranges, or specific x,y index locations.
Selecting Data Using Labels: Column Headings
We use square brackets [] to select a subset of a Python object. For example,
we can select all of data from a column named species_id from the surveys_df
DataFrame by name:
surveys_df['species_id']
You can also call the column as an attribute, which gives you the same output as above
surveys_df.species_id
0         NL
1         NL
2         DM
3         DM
4         DM
        ...
35544     AH
35545     AH
35546     RM
35547     DO
35548    NaN
Name: species_id, Length: 35549, dtype: object
We can create a new object that contains the data within the species_id
column as a pandas Series:
surveys_species = surveys_df['species_id']
If we wish to view a set of columns, then we can pass a list of column names to select columns in the order we would like them in our subset. This is useful when we need to reorganize the data. NOTE: If a column name is not contained in the DataFrame, you will get an error.
View the species and plot number columns from the DataFrame:
surveys_df[['species_id', 'plot_id']]
      species_id  plot_id
0             NL        2
1             NL        3
2             DM        2
3             DM        7
4             DM        3
...          ...      ...
35544         AH       15
35545         AH       15
35546         RM       10
35547         DO        7
35548        NaN        5

[35549 rows x 2 columns]
The order you specify the column names is the same order they appear in the subset:
surveys_df[['plot_id', 'species_id']]
       plot_id species_id
0            2         NL
1            3         NL
2            2         DM
3            7         DM
4            3         DM
...        ...        ...
35544       15         AH
35545       15         AH
35546       10         RM
35547        7         DO
35548        5        NaN

[35549 rows x 2 columns]
Extracting Range Based Subsets: Slicing Subsets of Rows
Slicing using the [] operator selects a set of rows and/or columns from a
DataFrame. To slice out a set of rows, you must use the following syntax:
data_frame[start:stop].
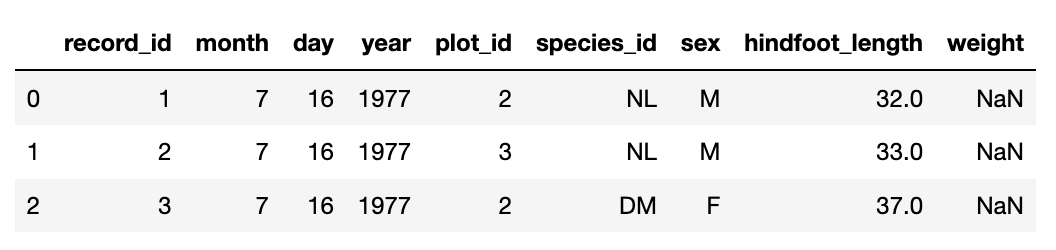
To select rows 0, 1, and 2 you specify the rows using the index ranges. Note that the
bounds you specify require that the start bound (0) is included in the subset and the stop bound
(3) is one index greater than the last row you want to include.
surveys_df[0:3]
Python slice syntax
The rules of Python slice syntax are as follows and also apply to lists, stings, and other sequential datatypes. The following example shows this using a list.
First create a list:
x = ['A','B','C','D','E','F','G','H','I','J']
x
['A', 'B', 'C', 'D', 'E', 'F', 'G', 'H', 'I', 'J']
Return the valuesAthroughE:x[0:5]['A', 'B', 'C', 'D', 'E']
Return the list starting atEthrough to the end:x[4:]['E', 'F', 'G', 'H', 'I', 'J']
Return the first 4 letters in the list (Note that this is the same asx[0:4]):x[:4]['A', 'B', 'C', 'D']
Return the last letter in the list:x[-1]'J'
The slice syntax includes a third component called the step. Wherex[start:stop:step]returns the list from thestartindex for everystepup to the index beforestop. The example below gives us every third letter in the list starting from0all the way to the end.x[::3]['A', 'D', 'G', 'J']
Slice syntax in R
It is important to be aware of the different ways in which Python and R allow you to slice and subset lists. Try to produce the same output as you just did for Python above, but this time use R. Start by creating the list of letters in your R environment (RStudio or R terminal):
> x <- c('A','B','C','D','E','F','G','H','I','J')
> x
[1] "A" "B" "C" "D" "E" "F" "G" "H" "I" "J"Remember: R begins indexing lists at 1.
Solution
With the same list:
['A','B','C','D','E','F','G','H','I','J'], Python and R will return the same output given the syntax below:
Result Python R AthroughEx[0:5]x[1:5]Ethrough to the endx[4:]x[5:length(x)]Print the first 4 letters x[:4]x[1:4]Print the last letter x[-1]x[length(x)]Print every 3rd letter x[::3]x[seq(1,length(x),3)]If you use Python slice syntax in R, most of what is in the above table will result in an error. For example if you type
x[:4]in R, you will get:Error: unexpected ':' in "x[:"One exception is that
x[-1]is a valid statement in R. Try doing this. What is returned when you use a negative value in the[]of a list in R?The other exception is that
x[0:5]andx[1:5]return the same output in R even thoughx[0]is not one of the list elements! In R, the statementx[0]will return a 0-length vector of the same type. This is ignored when you use the syntaxx[0:5], and the elements in1through5are returned.
Select a subset of rows from a column
Combine selecting a subset with column headings and slice syntax for rows. Get every 5th row for rows 20-60, from the columns
plot_id,species_id, andsex.Solution
surveys_df[['plot_id', 'species_id','sex']][20:61:5]plot_id species_id sex 20 14 DM F 25 15 DM M 30 15 DM F 35 16 OT F 40 23 DM F 45 19 DM M 50 21 DM F 55 20 DM M 60 23 DM M
Changing Values in a DataFrame
We can reassign values within subsets of our DataFrame. But before we do that, let’s make a copy of our DataFrame so as not to modify our original imported data.
surveys_copy = surveys_df
Now set the first three rows of data in the DataFrame to 0 for every column
surveys_copy[0:3] = 0
Next, print the first 6 rows of surveys_copy using the .head() method:
surveys_copy.head(6)
   record_id  month  day  year  plot_id species_id sex  hindfoot_length  \
0          0      0    0     0        0          0   0              0.0
1          0      0    0     0        0          0   0              0.0
2          0      0    0     0        0          0   0              0.0
3          4      7   16  1977        7         DM   M             36.0
4          5      7   16  1977        3         DM   M             35.0
5          6      7   16  1977        1         PF   M             14.0

   weight
0     0.0
1     0.0
2     0.0
3     NaN
4     NaN
5     NaN
Now print the first 6 rows of surveys_df
surveys_df.head(6)
What is the difference between the two data frames? Did surveys_copy = surveys_df make a
proper copy of the DataFrame?
Referencing Objects vs. Copying Objects in Python
We might have thought that we were creating a fresh copy of the surveys_df values when we
used surveys_copy = surveys_df. However, for objects of certain datatypes (like lists and
DataFrames) the assignment operator (=) only copies by reference.
That is, it creates a new variable name “surveys_copy” binds it to the same
object surveys_df refers to.
This means that there is only one object
(the DataFrame), and both surveys_df and surveys_copy refer to it. So when we assign
the first 3 rows
the value of 0 using the
surveys_copy DataFrame, the surveys_df DataFrame is modified too.
To create a fresh, duplicate
copy of the surveys_df
DataFrame we use the syntax surveys_copy = surveys_df.copy().
But first we have to read the surveys_df again
because the current version contains the unintentional changes made to the first 3 rows.
surveys_df = pd.read_csv("surveys.csv")
surveys_copy= surveys_df.copy()
Now reassign the first three rows to have the value 0 for all columns:
surveys_copy[0:3] = 0
Print the first 5 rows of both DataFrames:
surveys_copy.head(5)
surveys_df.head(5)
Did both DataFrames get altered this time?
Slicing Subsets of Rows and Columns
We can select specific ranges of our data in both the row and column directions using either label or integer-based indexing.
iloc: indexing via integer indicesloc: indexing via labels
To select a subset of rows AND columns from our DataFrame, we can use the .iloc[]
index. For example, we can select month, day and year (columns 2, 3 and 4 if we
start counting at 1) for the first 3 rows in the DataFrame, like this:
surveys_df.iloc[0:3, 1:4]
   month  day  year
0      7   16  1977
1      7   16  1977
2      7   16  1977
Notice that we asked for a slice from 0:3. This yielded 3 rows of data. When you ask for 0:3, you are actually telling python to start at index 0 and select rows 0, 1, 2 up to but not including 3.
Alternatively, .loc[] requires that you use labels to access the rows (row labels are their integer indices) and columns (column names).
Here we can access the species_id for row number 5:
surveys_df.loc[5, 'species_id']
'PF'
If we want to use .iloc[] to access that same cell we would use:
surveys_df.iloc[5, 5]
'PF'
Thus there are many different ways to access our DataFrame. Here’s another example: we can select all the columns for rows with index labels 0 and 10:
surveys_df.loc[[0, 10], :]
    record_id  month  day  year  plot_id species_id sex  hindfoot_length  \
0           1      7   16  1977        2         NL   M             32.0
10         11      7   16  1977        5         DS   F             53.0

    weight
0      NaN
10     NaN
Or we can just view the species_id, plot_id, and weight of observation 777:
surveys_df.loc[777, ['species_id', 'plot_id', 'weight']]
species_id    DM
plot_id        8
weight        36
Name: 777, dtype: object
NOTE: Labels must be found in the DataFrame or you will get a KeyError. The
start bound and the stop bound are included when using .loc[] to access rows, integer indices
because they refer to the index label and not the position. Thus
when you use .loc[], and select 1:4, you will get a different result than using
.iloc[] to select rows 1:4.
Here we use .iloc[] to get the first 2 columns for rows 1, 2, and 3:
surveys_df.iloc[1:4, :2]
   record_id  month
1          2      7
2          3      7
3          4      7
If we use .loc[] to select 1:4, then this will include all of the elements with the specified labels:
surveys_df.loc[1:4, ['record_id','month']]
   record_id  month
1          2      7
2          3      7
3          4      7
4          5      7
Access specific values using
.loc[]and.iloc[]
Use
.loc[]to view thespecies_idandsexof the animals observed in row 1, 3, and 5Use
.iloc[]to view the same thing.Solution
# 1
surveys_df.loc[[1, 3, 5], ['species_id','sex']]

# 2
surveys_df.iloc[1:6:2, [5,6]]
Subsetting Data using Criteria
We can also select a subset of our data using specific criteria. For example, we can select all rows that have a year value of 2002.
surveys_df[surveys_df.year == 2002]
record_id  month  day  year  plot_id species_id  sex  hindfoot_length  weight
33320      33321      1   12  2002        1         DM    M     38      44
33321      33322      1   12  2002        1         DO    M     37      58
33322      33323      1   12  2002        1         PB    M     28      45
33323      33324      1   12  2002        1         AB  NaN    NaN     NaN
33324      33325      1   12  2002        1         DO    M     35      29
...
35544      35545     12   31  2002       15         AH  NaN    NaN     NaN
35545      35546     12   31  2002       15         AH  NaN    NaN     NaN
35546      35547     12   31  2002       10         RM    F     15      14
35547      35548     12   31  2002        7         DO    M     36      51
35548      35549     12   31  2002        5        NaN  NaN    NaN     NaN

[2229 rows x 9 columns]
Or we can select all rows that do not contain the year 2002.
surveys_df[surveys_df.year != 2002]
We can define sets of criteria too:
surveys_df[(surveys_df.sex == 'M') & (surveys_df.year <= 1985)]
Records by weight and year
Select a subset of rows in the
surveys_dfDataFrame that contain data from the year 1999 and that contain weight values less than or equal to 8. How many rows did you end up with?Solution
surveys_df[(surveys_df.weight <= 8.0) & (surveys_df.year == 1999)]record_id month day year plot_id species_id sex hindfoot_length \ 29082 29083 1 16 1999 21 RM M 16.0 29196 29197 2 20 1999 18 RM M 18.0 29421 29422 3 15 1999 16 RM M 15.0 29903 29904 10 10 1999 4 PP M 20.0 29905 29906 10 10 1999 4 PP M 21.0 weight 29082 8.0 29196 8.0 29421 8.0 29903 7.0 29905 4.0
Iterating Over a DataFrame
To iterate over a data frame using a loop, we
can access the row and its index using the
.iterrows() method. First, create a variable
that just contains the data for observations of
the species Onychomys torridus.
surveys_OT = surveys_df[surveys_df.species_id == 'OT']
Let’s say that we want to calculate the average hind foot length. With this subset DataFrame, we can iterate over the rows and calculate the sum of the hind foot length and count the number of observations we have (remember that we might not have gotten that measurement for every observation).
sum_hfl = 0.0
count = 0
for index, row in surveys_OT.iterrows():
    hfl = row['hindfoot_length']
    if(pd.isna(hfl) is False):
        sum_hfl += hfl
        count += 1
The Pandas method .iterrows() returns the index of the row and the row as a Pandas series object.
This allows us to access the column values easily.
We use the Pandas function pd.isna() to check if the row has a value for hindfoot_length. If that cell is empty, it is not factored into the calculation of the average.
Now we can compute the average hind-foot length:
ave_OT_hfl = sum_hfl / count
print(ave_OT_hfl)
Let’s compare this value to the one calculated by Pandas:
print(surveys_OT.hindfoot_length.mean())
Adding a New Column to a DataFrame
Perhaps we want to add a value, notation, or other information to our DataFrame. This is easily done by just initializing the value. We will do this for our copy of the DataFrame, for only the observations made in the year 2000.
surveys_2000 = surveys_df[surveys_df.year == 2000].copy()
Now we can iterate over the rows in our new DataFrame, compute the value and add it to the DataFrame in the column 'new_value'.
for index, row in surveys_2000.iterrows():
    hfl = row['hindfoot_length']
    weight = row['weight']
    if(pd.isna(hfl) is False and pd.isna(weight) is False):
        surveys_2000.loc[index,'new_value'] = hfl / weight
View the summary of this new column:
surveys_2000.new_value.describe()
Key Points
Python can be used to work with complex data structures.